This demo contains an example Tableau Dashboard displaying video game sales which can be downloaded from Tableau here.
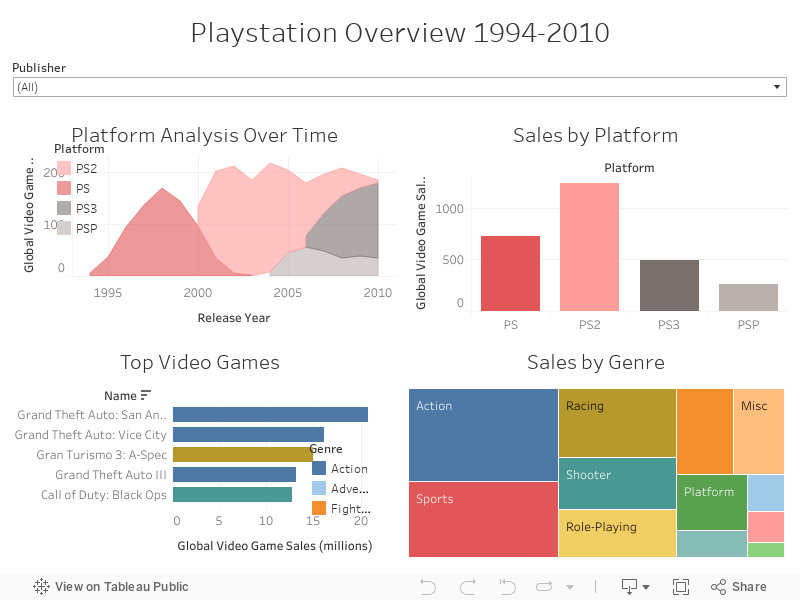
Fig. 1 shows an example interactive dashboard for Video Game Sales from 1994 - 2010 made in Tableau, focussing on products by Sony (Playstation 1,2,3 and Playstation Portable).
Creating dashboards like this is useful for interacting with and investigating data. In this example dashboard, the Sales by Genre tree map (bottom right) and Sales by Platform bar chart (top right) can be activated as filters by clicking on them, which changes the contents of the other charts.
For example, by using the Publisher drop-down menu, we can quickly discover that the top selling video game published by Electronic Arts in the Simulation genre for the PS2 console was “The Sims” with 2.77 million global sales in 2003. To verify this:
After doing so, the Top Video Games horizontal bar chart will show “The Sims” in the top spot, and hovering over it with the mouse shows the sales information we quoted.