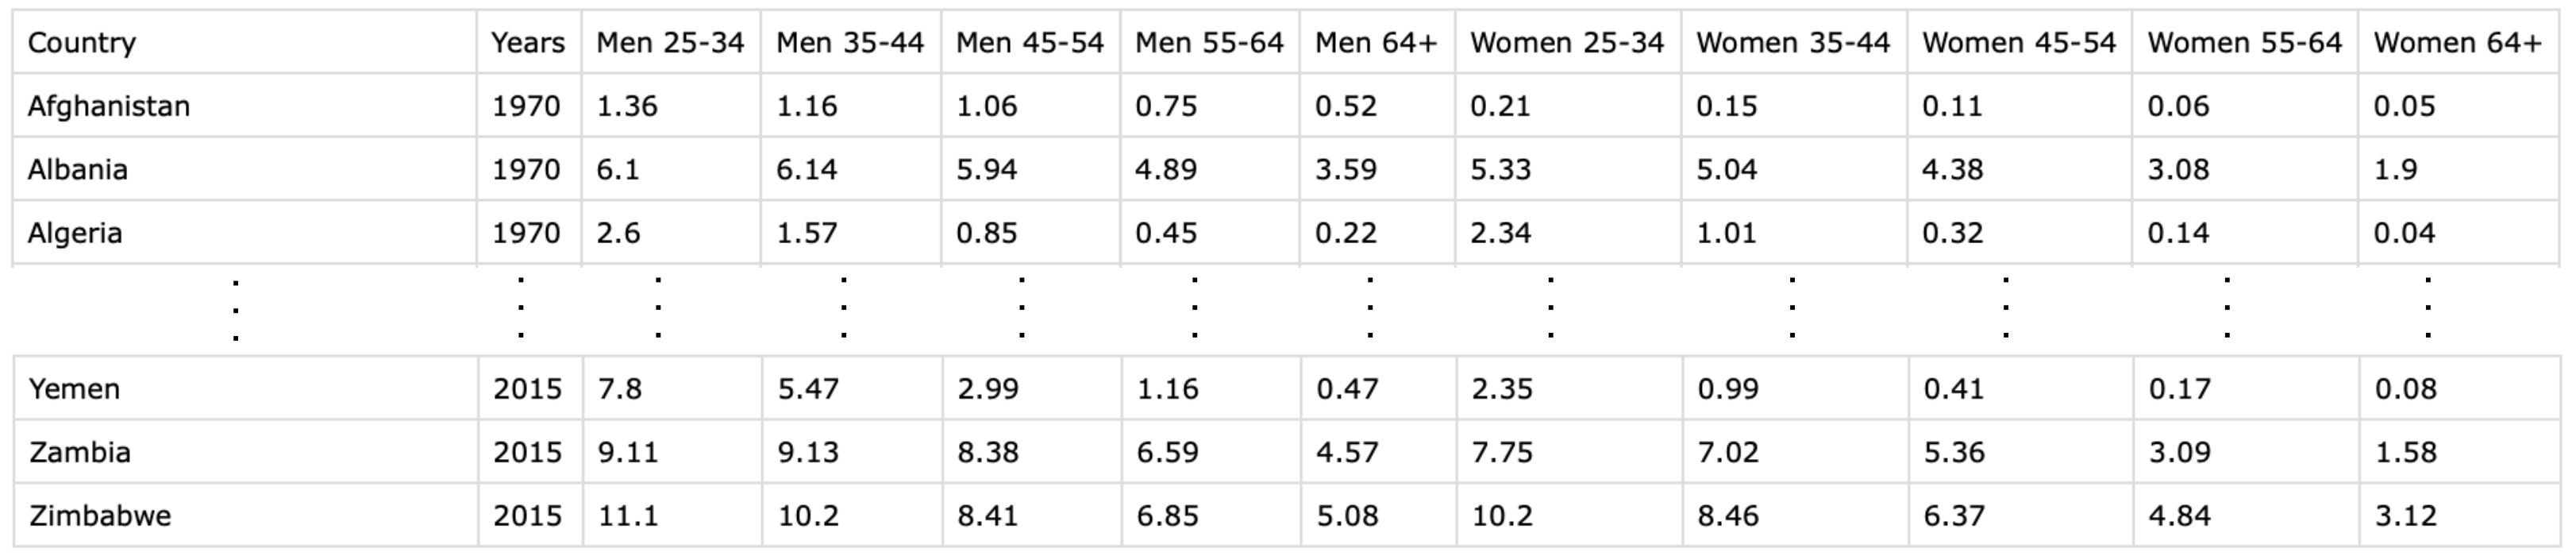
 Table 1 Sample of the “mean years spent in school” dataset (source: https://www.gapminder.org/data)
This demo investigates the average number of years people spend in school among the G20 countries. I answer the questions:
All figures in this demo are interactive/clickable and embedded from the workbook hosted on Tableau public, which is available to download here.
The mean_years_school.csv dataset in Table 1 shows the average number of years men and women stay in school for different age brackets for 187 countries from 1970 until 2015, comprising ~6800 rows of data.
This is a useful indicator of social and economic development.
Table 1 Sample of the “mean years spent in school” dataset (source: https://www.gapminder.org/data)
In this part we will answer the first question.
By focussing on on the 25-34 age bracket across the 45 years of data we can get a good idea about the answers to our questions. This is sensible because the amount of time people spend in formal education decreases with age, so the youngest age bracket available should still contain the bulk of the interesting information.
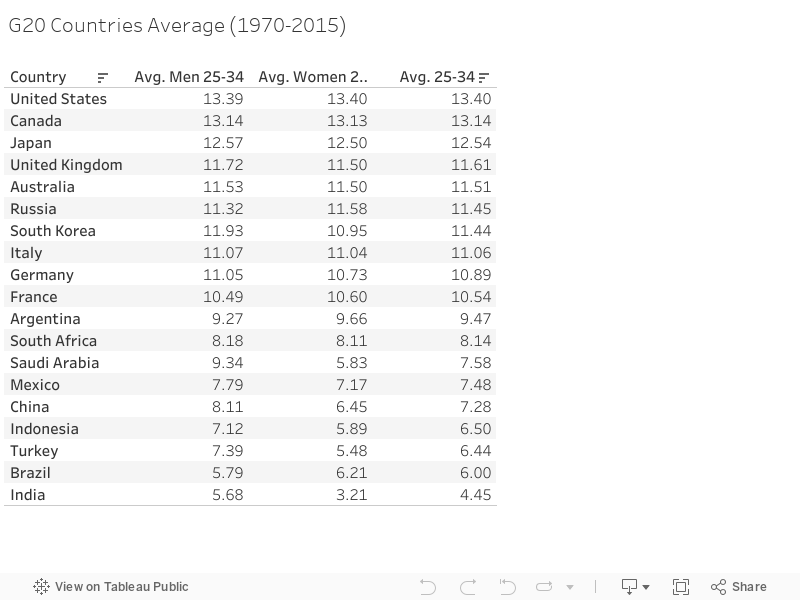
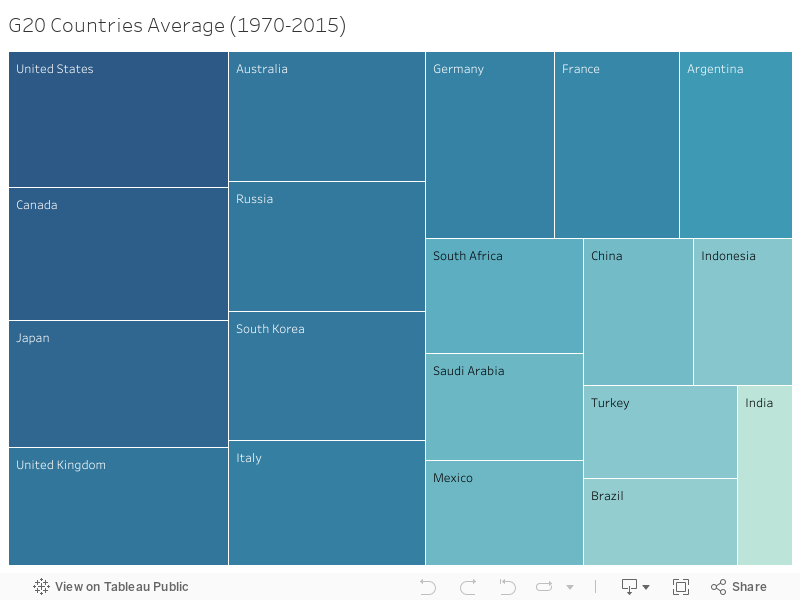
Fig. 1 shows the years spent in school for the G20 countries averaged across all years in the dataset.
Some details:
Country field.[25-34] = ([Men 25-34] + [Women 25-34])/2 estimates the average across both genders. On first glance of Fig. 1, it appears the USA has the largest average years spent in school. However, as shown in Fig. 2, it turns out that this is only due to an early lead; in fact, the USA is in fact the only G20 country which shows any kind of plateau in the dataset. This occurs in the 1990s, during which Canada and then later Japan overtakes the US for 1st and 2nd place respectively.
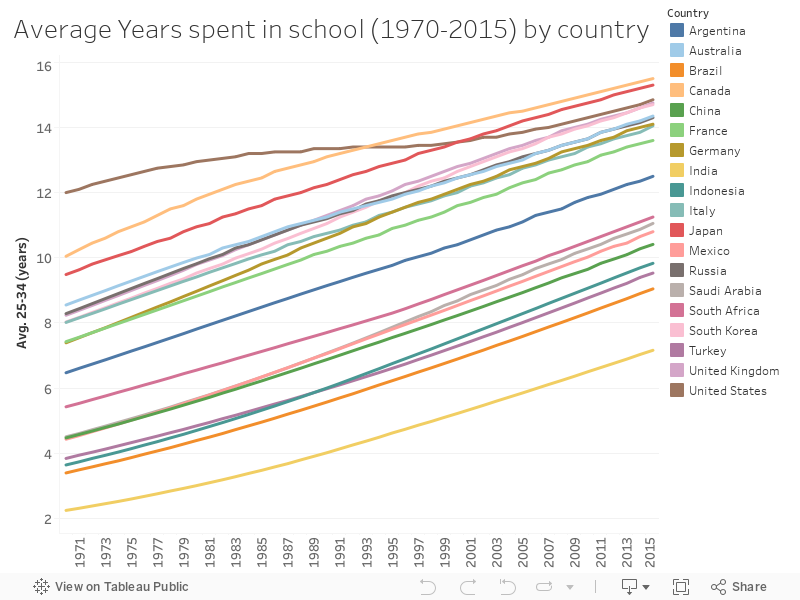
In conclusion, yes, the average number of years spent in school is generally increasing for the G20 countries, however, progress stalled in one country – the USA – during a 10 year period in the 1990s, after which it began to increase again.
In this part we answer the second question. Just as in part 1, we can focus on the 25-34 years age bracket to get a good sense of the answers to our questions.
To get an idea about equality between men and women we could investigate either the difference or the ratio between men and women’s mean years in school and similarly look at how this has changed over time.
Some notes:
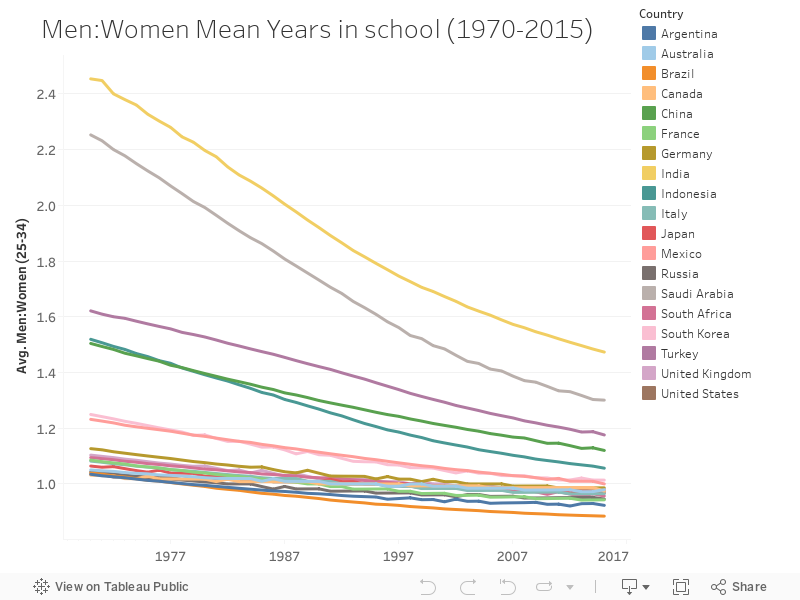
[Men:Women (25-34)] = [Men 25-34] / [Women 25-34] was used.exclude.From Fig. 3 we can immediately see that India and Saudi Arabia have had the most dramatic changes, with their ratios dropping by nearly 1 across all years of data. These countries also especially stand out from the others by their significantly larger negative gradients across the initial half of the data, from 1970 to around 1995.
To be more specific, by comparing their absolute numbers side by side, we can further quantify that India has had the largest change out of the two:
| India | Saudi Arabia | |
|---|---|---|
| 1970 | 2.454 | 2.253 |
| 2015 | 1.473 | 1.301 |
| Difference | 0.981 | 0.952 |
By 2015 Indian men have an average of 1.47 years of schooling for every year of schooling Indian women have, down from 2.45 years in 1970. It is notable, however, that India is still the furthest country away from equality, and that its negative gradient has become flatter over time which indicates a slowing of progress somewhat.
In conclusion, we therefore can confidently answer the question with “India and Saudi Arabia stand out as having the greatest shifts towards equality between men and women, with the fastest initial shifts towards equality, while out of the two India had the greatest absolute shift overall”